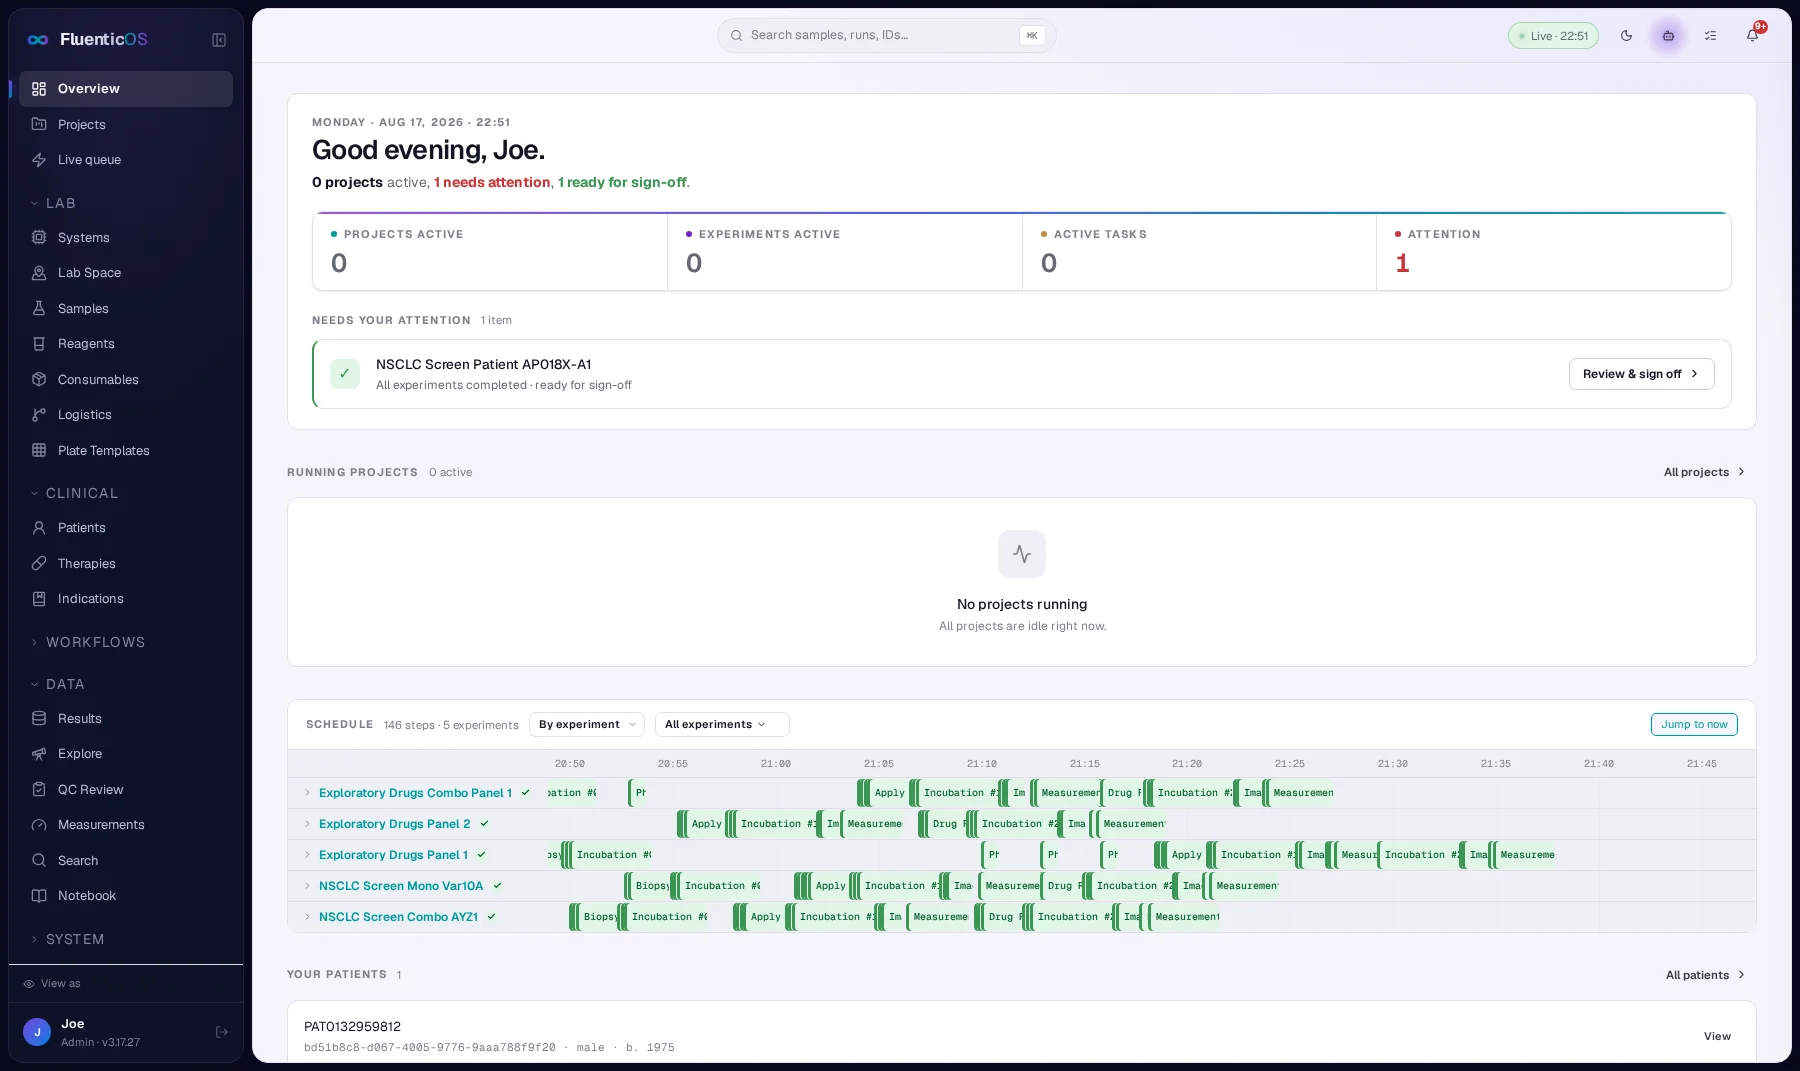
The operating system for labs to plan, execute, analyze, automate, and track any research experiment, manual, semi-automated, or fully robotic.
FluenticOS is an all-in-one lab operating system for any kind of research: experimental protocol design, a real-time scheduler, ELN/LIMS, data analysis and data management, an AI assistant, and edge-agents connecting every instrument, worked by hand or run end to end by a robot. Role-based access shows each person exactly what their job needs, every instrument talks back over an authenticated line, and a full audit trail sits behind every result. Purpose-built by someone with deep experience in lab research, data engineering, lab automation, and machine learning.
No install required for scientists: edge agents handle the instrument side.
Who profits most
The same system of record, read differently depending on who's asking.
Scientists
Design a multi-day, multi-step experiment as a flowchart in minutes, then let the scheduler and analysis pipelines run it. Ask the assistant "why is this step blocked" and get a plain-language answer instead of digging through logs.
Lab technicians & operators
Every step run carries a plain-language briefing, task by task, whether it's claimed at the bench through the edge control UI or run automatically by a driver.
Project leads & PIs
One live view of every experiment's progress across every instrument, with a priority-aware scheduler that reprioritizes on its own the moment something slips, instead of a status meeting.
QA & compliance teams
A result traces back through every hop to the originating sample, coded against the ontologies and standards already in use, so "where did this number come from" is a click, not a support ticket, and role-based access means every person only sees what their role is cleared for.
A lab data platform, in three sentences
Why
Multi-day, multi-instrument experiments still run on whiteboards, sign-off sheets, and tribal knowledge. Protocols drift from what actually happened on the bench, and by the time a result reaches a report, tracing it back to the originating sample is a support ticket, not a click.
- Closed-loop learning: models ingest experimental output automatically to help design the next iteration, without manual transcription.
- Higher reproducibility: eliminates human pipetting and data-entry errors, and standardizes complex environmental conditions.
- Reduced cost & time: accelerates throughput while cutting material waste and human bottlenecks.
What
FluenticOS is the operating system for the lab: one system of record that plans a protocol as a flowchart, schedules and runs it across real instruments, and keeps every sample, measurement, and action traceable from source sample to final result.
- One ELN/LIMS system of record: protocols, experiments, instruments, samples, and results live in one place instead of six disconnected tools and spreadsheets.
- Full traceability: every sample, measurement, and action is linked from source sample to final result, audit-ready by default.
- Automated analysis pipelines: dose-response curve fitting, segmentation, and other analyses run themselves, configured per protocol, not hardcoded.
How
A priority-aware scheduler recomputes the whole plan continuously across every instrument and consumable. Edge agents at the bench claim and report work over an authenticated, receive-only line, so the plan of record and the physical lab never drift apart.
- Resource-aware orchestration: a priority-ordered scheduler continuously recomputes the plan across every instrument and consumable; capacity and dependency order are hard constraints, never negotiable.
- Agents that only ever report in: a small process at each instrument claims scheduled work and reports results back over authenticated REST; the platform never pushes a command to a device.
- Manual or robotic, same protocol: a driver interface lets any instrument run a step automatically or via an operator checklist, with no change to how the protocol is designed.
0
Data analysis DAGs quietly running safety nets behind every claim, poll, and heartbeat
0
Typical time for a claim or state change to reach a blocked edge agent via long-poll sync
0
Sample lineage traced from source tube to individual well
0
Commands ever pushed to an instrument: the platform is receive-only, by design
One system plans the protocol, runs it on the bench, and proves what happened, end to end, instead of stitching together a scheduler, a spreadsheet, and a shared drive.
Explore the technical detail
Every claim above has a real screen and a real mechanism behind it. Jump straight to any of them.
Visual protocol editor
Drag step templates onto a canvas, wire typed connections, version draft to released.
Step inspector
Click any node to configure its schedule, parameters, and simulate toggle, inline on the canvas.
Protocols & pipelines
Every screen and analysis DAG ever designed, versioned and catalogued by accession ID.
Lab Space
Every instrument mapped to your real bench layout, with live device state.
Real-time scheduling
A priority-ordered, resource-aware scheduler that recomputes the global plan continuously.
Systems registry
Instruments, compute, services, and people, in one heartbeat-monitored table.
Sample lineage
Full chain of custody from source tube to individual well.
Reagents & drugs
Working drug preparations traced back to their source stock lot, concentration, and expiry.
Therapy knowledge base
Targets, indications, and PK data per therapy, synced with linked CIViC evidence and biomarkers.
Consumables & kits
Plates, tubes, bottles, and slot-validated kits, tracked from registered to processed.
Data explorer
Table, plate map, scatter, and dose-response views over every well, filterable and exportable.
Logistics
Know where every consumable is right now, and move it with a scan.
Audit trail & notebook
Every state change and note merged into one append-only experiment timeline.
Every layer of the lab, in one system of record
From how a protocol is drawn to how a plate or sample physically moves between instruments: FluenticOS is built around the real shape of a research workflow, run by hand, by robot, or anywhere in between.
Design protocols like flowcharts, not spreadsheets
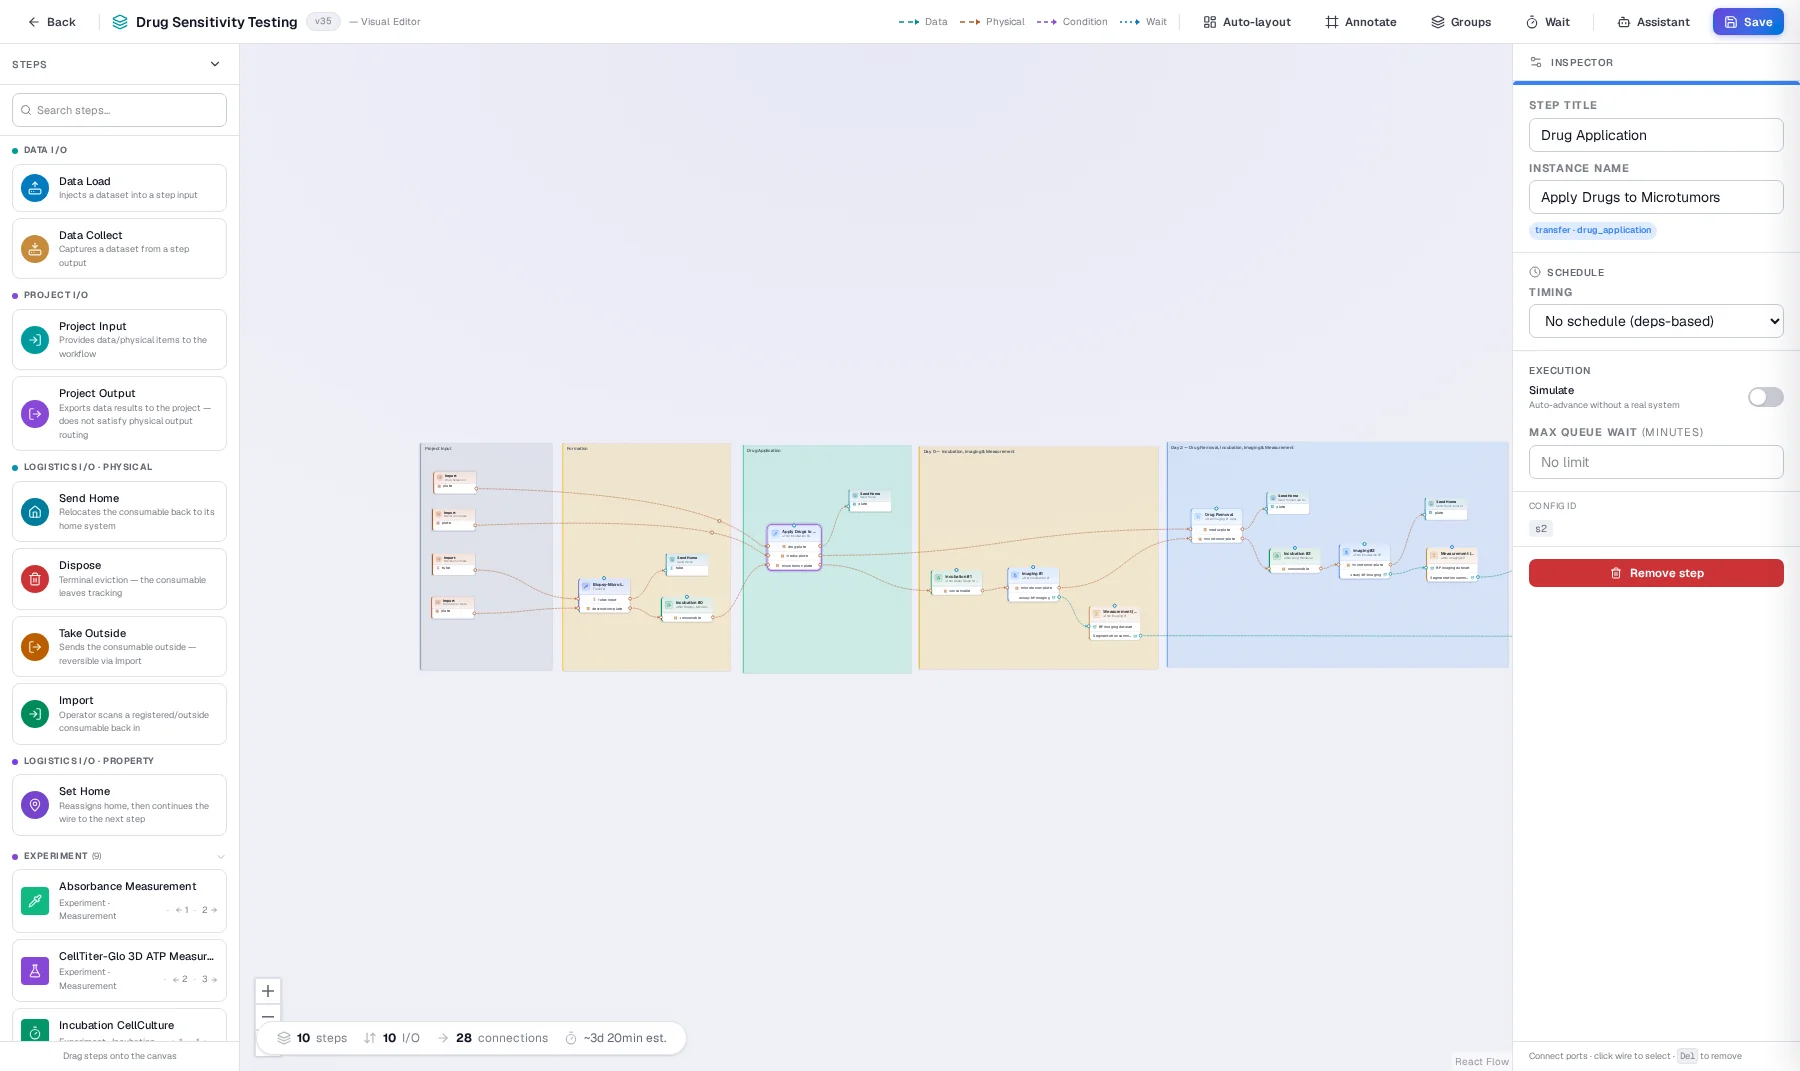
Drag step templates onto a canvas and wire them with typed connections: data, physical consumable movement, conditional branches, or timed waits. Groups, auto-layout, and an inline assistant keep a multi-day experiment legible, like Drug Sensitivity Testing below: formation → drug application → two incubation/imaging/measurement cycles → project output, six lanes end to end. DAG validity is checked at design time, not discovered mid-run.
Every protocol and pipeline, versioned and catalogued
Protocols and data pipelines are both reusable templates, each with its own accession ID and version history from draft to released. The Protocols table lists every screen ever designed with its step count and status at a glance; a matching Pipelines table holds the analysis DAGs an experiment runs once results land, wired in the same editor.
See every instrument, exactly where it lives
Lab Space is a physical map of your instruments across buildings and floors, placed against your actual bench layout, not a generic list. Each device shows live state at a glance: idle, busy, full, in error, or under maintenance, with load meters for multi-slot incubators and storage.
One global plan, real-time, fully dynamic and adaptive
A priority-ordered, resource-aware scheduler continuously walks the whole DAG across every system and consumable: capacity, incubation limits, dependency order, and error lockout are hard constraints; due-dates and ordering are soft, minimized by a priority score that ages starved steps upward. The same plan drives the Gantt, the edge-agent timeline, and claim-order enforcement.
Instruments, compute, services, and people: one registry
Every system in the lab is a first-class record: liquid handlers, imagers, incubators, GPU inference services, even lab personnel. Heartbeats, load, parent/child relationships, and physical-vs-simulated status are all visible in one table, the same registry the scheduler claims against.
Full chain of custody, from source sample to well
Samples carry lineage (derived_from and pooled_from) so any derived sample, a microtumor well, an organoid, a processed aliquot, can be traced back through every derivation step to its origin. Filter down to a specific sample type, biopsies in this example, and every row still shows its indication, ontology code, and parent record, not a bare accession ID. Consumables and kits are slot-validated, so a 384-well plate always knows exactly what's registered in every position.
Reagents traced from stock vial to working dose
The Stocks tab holds source lots at their stock concentration; the Drugs tab holds every diluted working preparation, each one linked back to its source stock by accession ID, not a freehand note. Concentration, lot, expiry, and state (available, in use, depleted, expired) are tracked identically for both, so a plate's exact dosing is never a guess.
Every plate, tube, and kit, tracked by state
Consumables covers every physical container in the lab: plates, tubes, bottles, and multi-slot kits, each carrying a type, format, and purpose, and moving through the same lifecycle (registered, in use, processed) regardless of what it holds. Kit templates enforce which slots take a sample and which take a reagent, so a kit can't be assembled wrong in the first place.
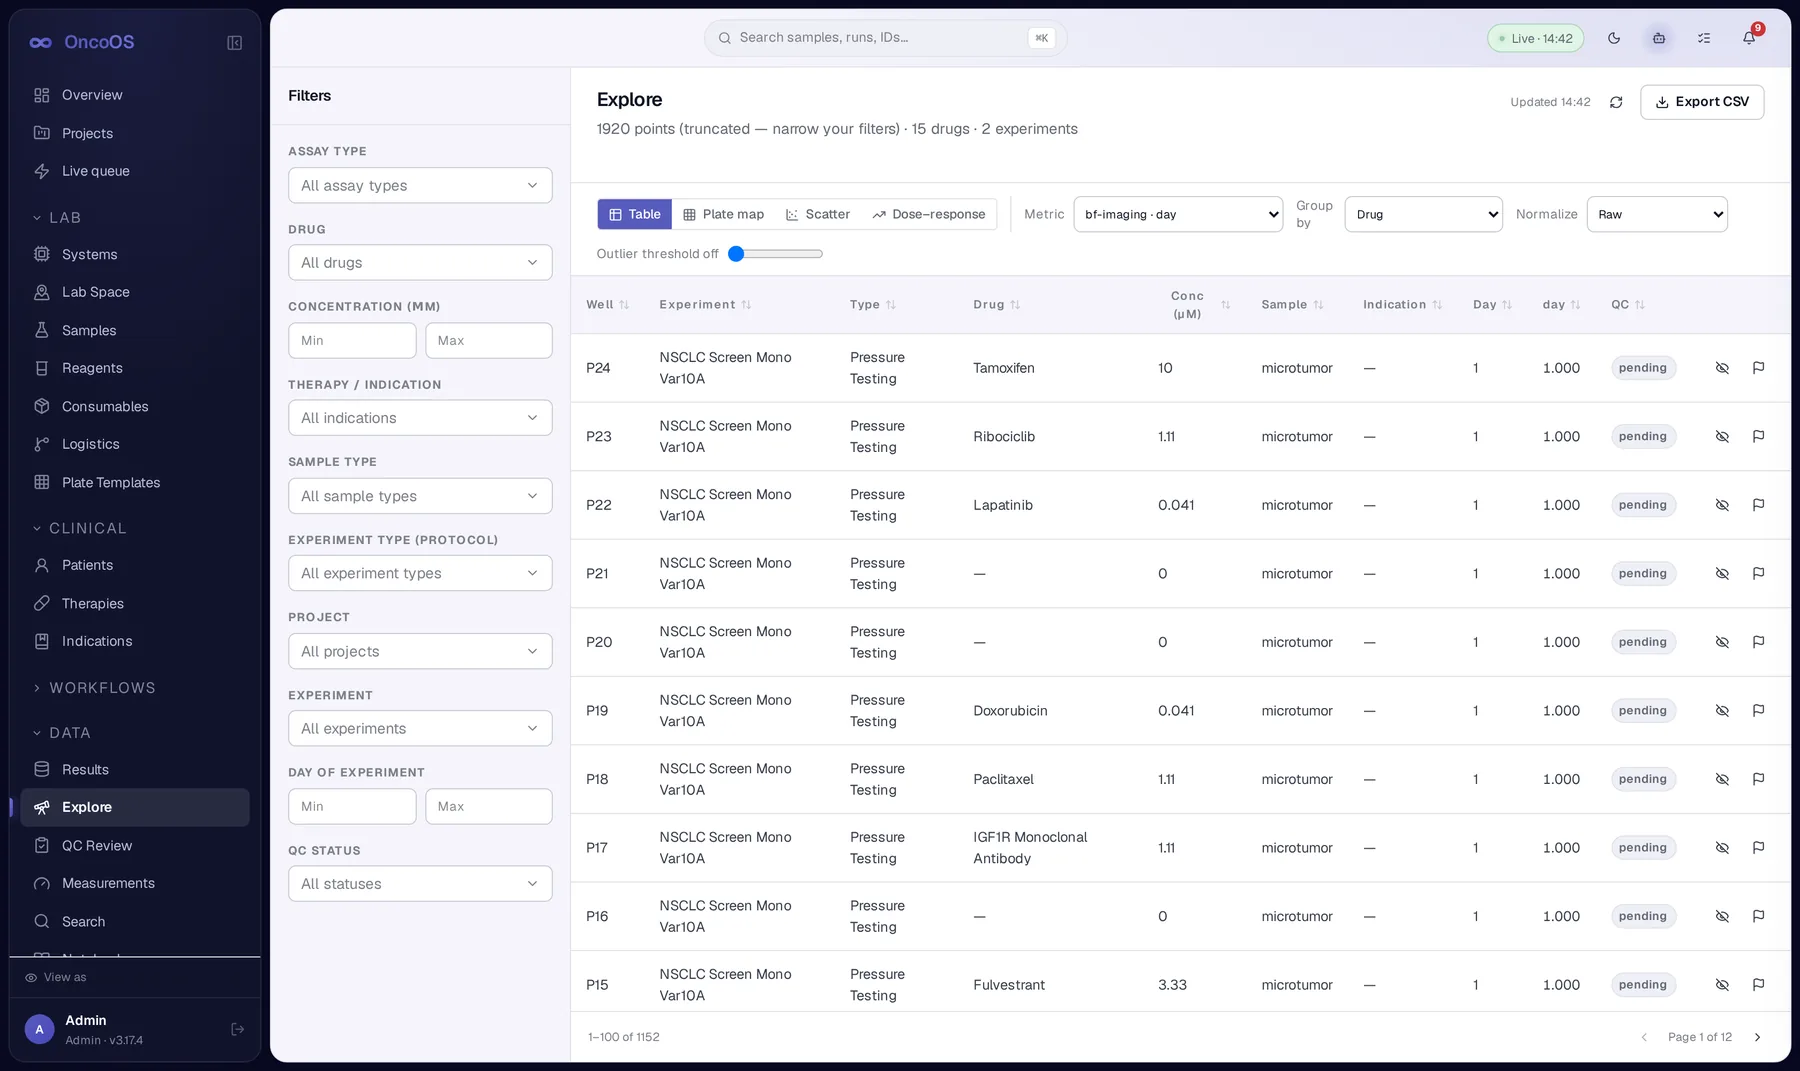
Query every well like a spreadsheet, plot it like a scientist
Explore filters by drug, concentration, indication, sample type, and QC status across every experiment, then switch between table, plate map, scatter, and dose-response views without losing the filter state. Export straight to CSV when it's time to leave the platform.
Know where every consumable is, and move it with a scan
Logistics groups every registered consumable by its current physical location, an instrument system or off-device storage, so a lab lead can expand the Cell Incubator card and see exactly what's docked there right now: accession ID, contents, and state, without walking the bench. Transfer moves a scanned consumable to a new system or into storage; Derive distributes a sample across selected wells into new child samples; Pool merges multiple source samples into one. All three are logged as first-class relocation hops, with concurrent blockers surfaced instead of silently queued.
Every action logged, every note in one place
Every state transition, claim, and system event on an experiment is written to an append-only history and merged into a single notebook timeline alongside free-text notes. Notes can be authored centrally by a scientist in the web app, or filed at the bench by an operator through the edge agent's control UI: both attach to the same experiment or step run and appear side by side, author included, so "who changed what, and why" never depends on someone remembering to write it down separately.
Every step, individually configurable
Click any node on the canvas and the inspector opens beside it: instance name, timing (dependency-based or a fixed schedule), simulate toggle, max queue wait, and the full parameter set for that step template, no separate settings screen. Below, the Drug Application step from the same protocol is open for edit while the rest of the DAG stays in view.
A therapy knowledge base, not just a drug list
Every therapy carries its targets, approved indications, synonyms, and PK parameters, and where a CIViC record exists it's linked and synced in: evidence items, biomarkers, clinical significance, all one click away from the compound a screen is dosing with. Select a therapy from the list and the full record opens in a slideover, like Cetuximab below: 159 evidence items and 59 biomarkers pulled in from CIViC.
Built for the parts of the workflow that don't fit in a demo
Automated analysis, configured not hardcoded
Dose-response curve fitting, segmentation, and other pipeline steps are configured per protocol (model, thresholds, control roles), so an analysis run stays specific to the screen instead of a one-size-fits-all script.
Logistics & relocation
Physical consumable moves (robotic or manual) are tracked as first-class hops, with concurrent blockers surfaced instead of silently queued.
Role-based access & display
Scientist, lab technician, project manager, clinician, viewer: both navigation and what data is shown adapt per role, with an admin impersonation view for support.
QC review
Review well-level measurements against a plate map and record QC decisions before data ever reaches an analysis pipeline.
Lab notebook
An electronic lab notebook that lives next to the data it describes, with every state change logged alongside it: no separate app, no copy-pasted screenshots.
Diagnostics
System health, flow registry, and agent tool status in one place, so "is it the instrument or the platform" stops being a guessing game.
Receive-only by design. Every instrument reports in: none get commanded
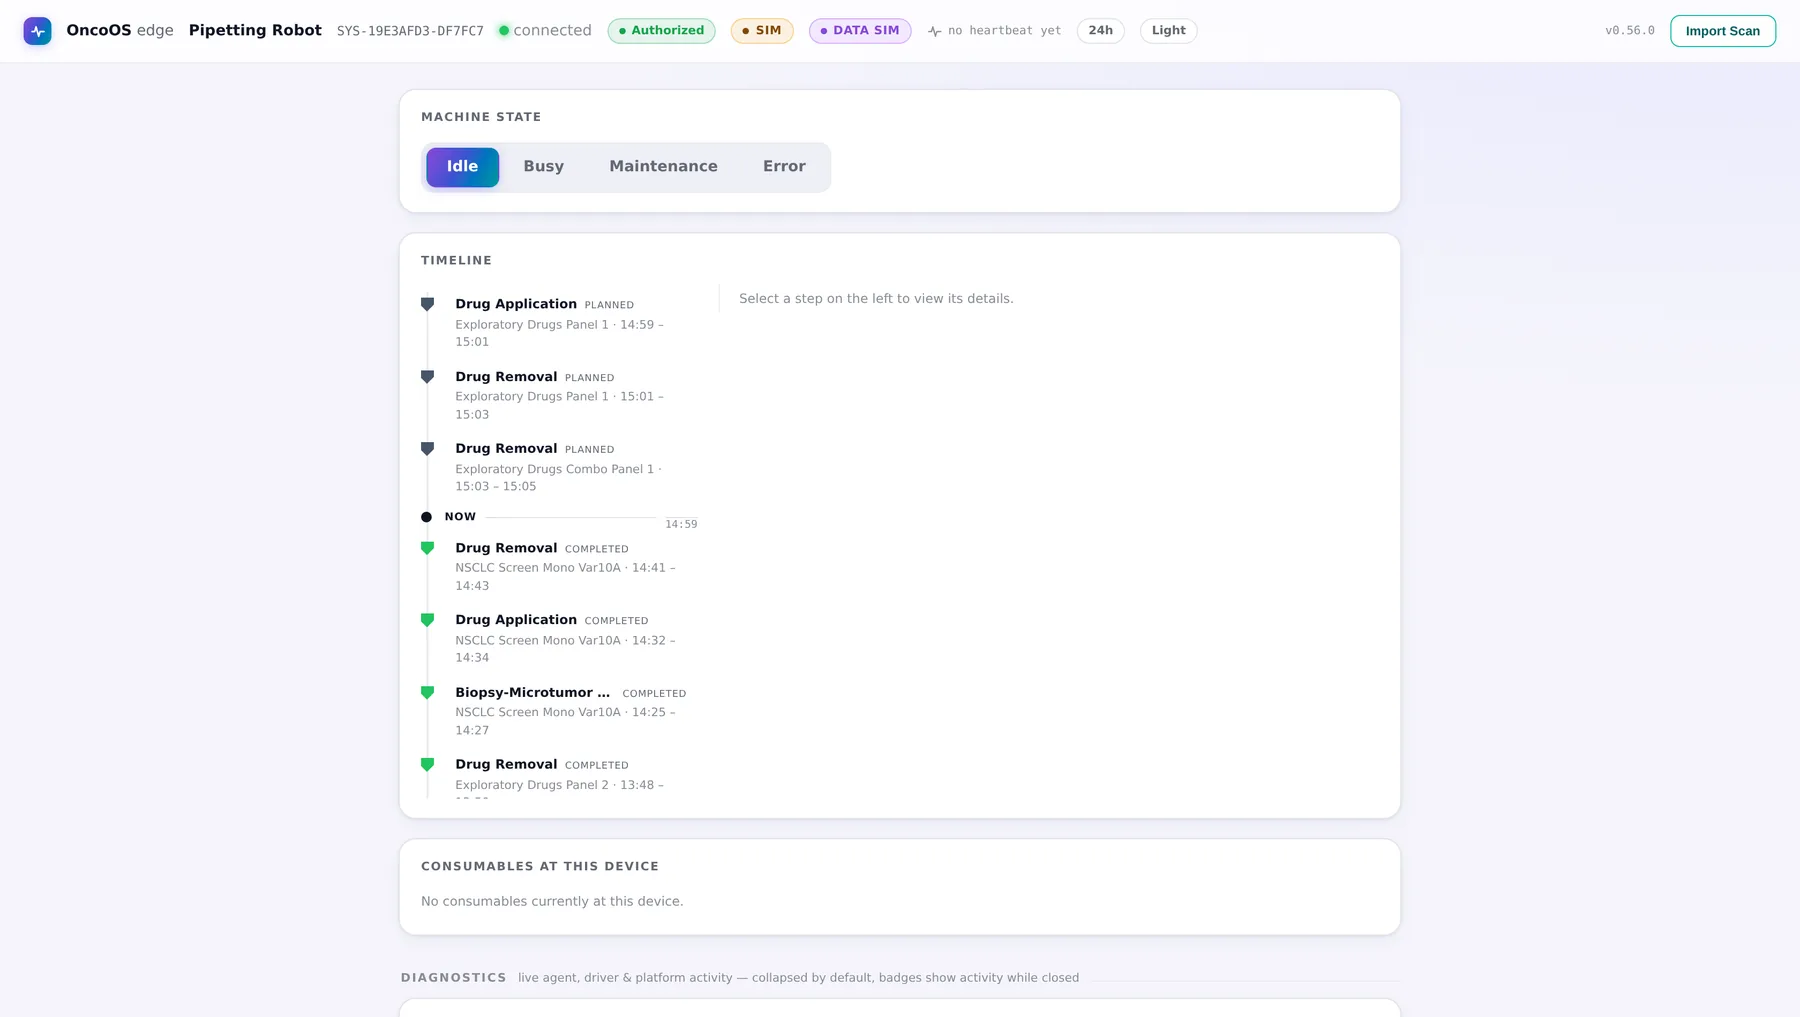
Edge agents run next to each instrument and talk to the platform over authenticated REST. The platform never opens a connection back to a device: it can only accept or reject what an agent reports.
The StepRun state machine is the spine of the platform
Every unit of work (a robotic move, an imaging pass, an incubation window) is a StepRun with the same lifecycle. A system error auto-suspends its running work instead of losing it; container state rolls up with a strict priority so a Gantt bar never lies about what's actually happening on the bench.
- Claims are first-come-first-served, capacity- and priority-checked, rejected synchronously on conflict
- A long-poll
sync/waitendpoint wakes blocked agents within moments of a state change - X-Agent-Token auth, minted at enrollment approval: no shared secrets, no standing commands
From a step template to a well of live cells
Step templates
Reusable building blocks: imaging, dispensing, incubation, analysis.
Protocols & pipelines
Templates wired into an ordered, versioned DAG.
Experiments
A protocol instantiated against real samples, consumables, and a project.
Step runs
Scheduled, claimed, and executed by the right instrument, in priority order.
Results
Measurements, images, and outputs flow back in, queryable within seconds.
Manual bench today, robotic bench tomorrow: same protocol either way
Every instrument in Lab Space is linked to the platform by an edge agent, a small process that runs next to the device, claims the step runs scheduled to it, and reports results back. Whether that step happens by robot or by hand is a property of the instrument, not of the protocol.
Fully automated
When an instrument has a driver (a SiLA 2 gRPC device, a serial device, a vendor SDK) the edge agent claims the step the moment it's schedulable and runs it end to end. A driver's only job is turning "please run this step" into a stream of readings; the runtime handles enrollment, auth, image upload, and retries underneath it. No operator touches it.
Manually operated
No driver configured? The step is scheduled and claimable all the same. The edge agent's local control UI turns the platform's step briefing into what to do at the bench: which consumable, which parameters, how many measurements are expected, plus the free-text instructions authored on the step template itself, task by task. An operator claims it, follows that checklist on the instrument's own software, then uploads the resulting files through that same briefing card.
Either way, results reach the platform through the same door: a scoped presigned upload followed by an authenticated measurement post. An automated driver's readings and an operator's manually uploaded files are ingested identically, same validation, same lineage, same Data Explorer on the other end.
An assistant you talk to, and agents that work inside the run
FluenticOS keeps the conversational assistant and the autonomous execution agent as separate services with separate tool surfaces, so "ask a question" and "act on the bench" are never the same permission.
Ask FluenticOS
The AI a scientist talks to directly, surfaced from anywhere in the app to explain a failure, summarize a plate, or answer "why is this step blocked" in plain language, grounded in the same live data the UI shows. It can also draft new step templates and protocols from a description and validate a design before anything is saved.
Autonomous step-run agents
A separate agent runtime that operates inside experiments, with tool access to create, edit, run, and troubleshoot experiments directly: instantiating runs, triggering pipelines, and executing bounded tool calls against step runs, all reviewable in Diagnostics.
Full lineage, standard ontologies, complete provenance
Every result traces back through a real chain of custody, source sample to derived sample to well, and where a study calls for it, clinical concepts are coded against the ontologies your organization already uses, not an in-house vocabulary. What follows is what that traceability looks like on a clinical drug-screening study; the same lineage engine tracks any sample type just as well, cell lines, environmental samples, materials, whatever your lab runs.
Patient
Pseudonymised record: an accession ID stands in for identity everywhere downstream.
Biopsy
Barcoded tissue sample, timestamped at collection: the root node every derived sample traces back to.
Derived sample
A microtumor, organoid, or cell culture: derived_from and pooled_from recorded automatically.
Plate & well
Placed into a slot-validated consumable under a drug plate design.
Measurement
A well-level result, queryable and traceable back through every hop to the biopsy.
Every sample carries a full timeline (created, lineage, step runs, measurements) so "where did this number come from" is always a click away, not a support ticket.
Patients
Pseudonymised records with linked biopsies: accession IDs stand in for identity everywhere downstream.
Biopsies
Each biopsy is a first-class, barcoded record linked to its patient and indication: the origin point of every downstream lineage graph.
Microtumors, organoids & cell culture
Samples derived or pooled from a biopsy carry that ancestry forward automatically, so a single well can be traced back through every derivation step to the originating tissue.
Drugs & therapies
The drug and regimen catalogue screens are weighed against, enriched with clinical evidence from validated to inferential, so a dose-response result sits next to what's already known about that drug.
Indications, ontology-mapped
Cancer indications carry standard codes (NCIt, ICD-O-3, SNOMED CT, ICD-10, MedDRA, DOID), so a screen's clinical question links out to the same vocabularies your EHR and tumor board already use.
Drug plate designer
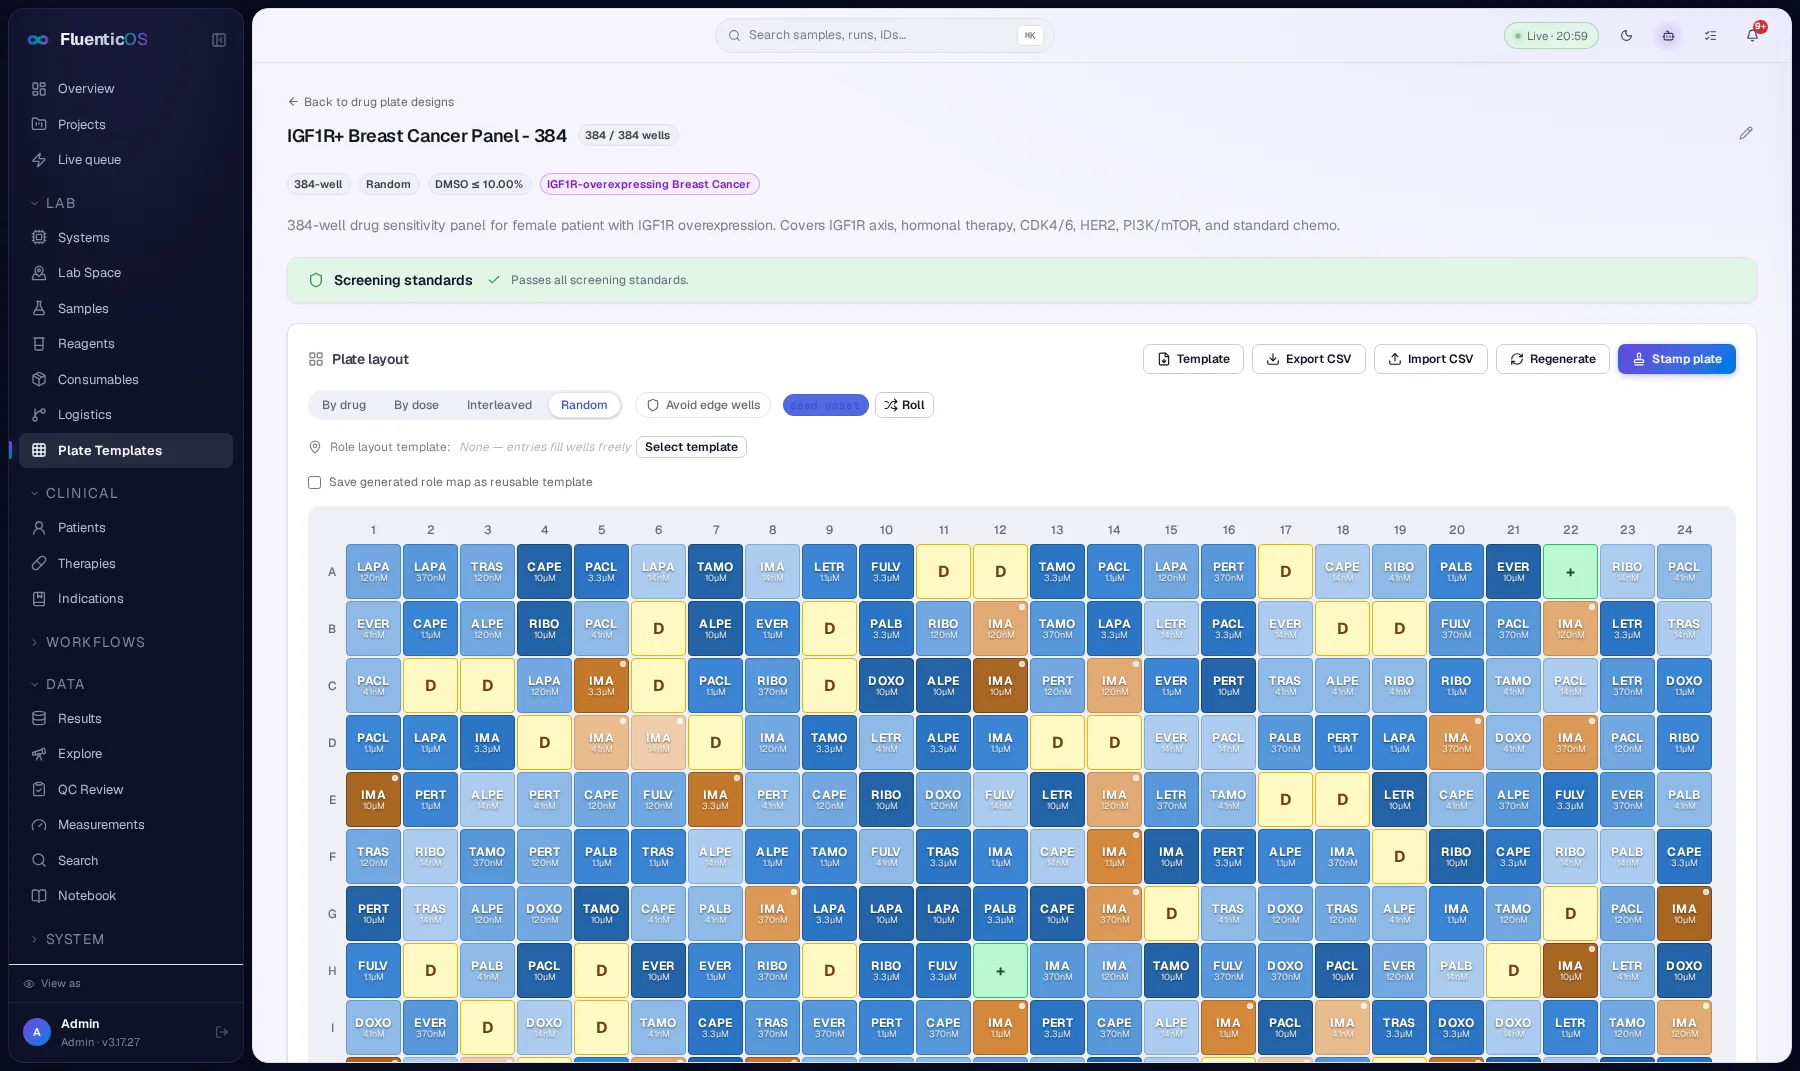
Lay out mono- and combination-therapy dose ladders across 96-, 384-, or 1536-well formats (by drug, by dose, interleaved, or randomized) with controls, DMSO limits, and Cmax-relative dosing built in, then check it against screening standards before materializing the design onto a real consumable.
See FluenticOS on your bench
This is a preview build: request early access and we'll walk you through a live protocol, a real edge-agent claim, and how your instruments would map onto Lab Space.